EvaluationAgency GovernanceSimone Figueira6 min read
The ACA Agency Scorecard: 15 Numbers You Should Review Every Week
Most agency dashboards track vanity sales metrics while ignoring operational leaks. Here are the 15 ACA numbers owners must review every Monday morning to safeguard revenue.
Most health insurance agency owners manage their business through the rearview mirror. They look at gross enrollment counts at the end of the month, glance at their bank balance, and assume that if production is high, the agency is healthy. In the ACA marketplace, that assumption is dangerous.
A brokerage can write two thousand policies during Open Enrollment and still lose thirty percent of its enterprise value by March through unworked Data Matching Issues (DMIs), uncollected first-month binders, missing consent documentation, and unreconciled carrier commission clawbacks. To build a resilient, high-valuation ACA operation, agency owners need a weekly governance rhythm centered on leading indicators rather than trailing vanity metrics.
In longitudinal benchmark research with agency clients operating on CRMDAY One, brokerages that implemented a formal Monday morning 15-metric scorecard review achieved a 22% higher 12-month client retention rate and recovered an average of $38,400 annually in uncollected carrier commission discrepancies.
The 4 Governance Pillars of the ACA Scorecard
A disciplined agency scorecard cannot be an unorganized laundry list of generic KPIs. It must be grouped into four operational quadrants that mirror how money, clients, and compliance flow through an ACA brokerage:
- Pillar 1: Inbound Lead Velocity & Pipeline Conversion (Numbers 1 to 5): Measures the speed, contact efficiency, and quote-to-application conversion of fresh demand before leads go cold.
- Pillar 2: Policy Effectuation & Client Quality (Numbers 6 to 8): Tracks whether enrolled policies actually turn into paying, covered lives and identifies early document vulnerabilities.
- Pillar 3: Book Defense & Regulatory Compliance (Numbers 9 to 11): Monitors client churn, predator Agent of Record (AOR) poaching, and mandatory 10-year audit documentation.
- Pillar 4: Revenue Realization & Unit Economics (Numbers 12 to 15): Reconciles expected carrier commissions against actual cash receipts and measures true cost per retained policyholder.
The 15 Weekly ACA Metrics: Formula, Benchmark & Action Trigger
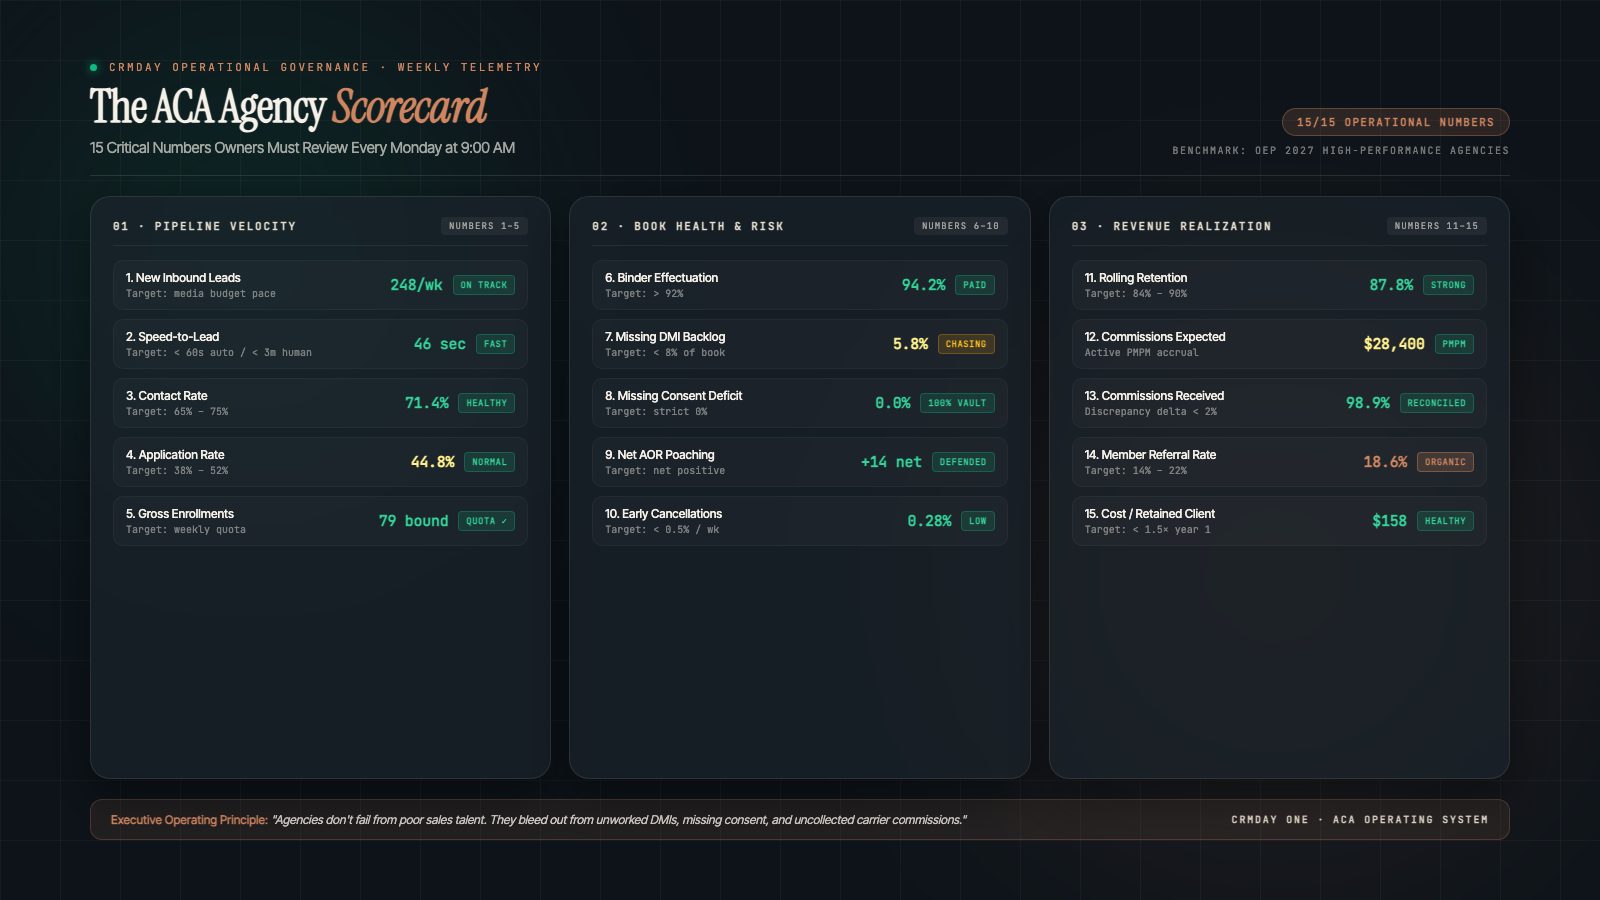
Below is the complete scorecard blueprint. Every Monday at 9:00 AM, the agency owner and leadership team should review these exact fifteen numbers:
| # & Metric Name | Operational Formula | ACA Industry Target | Executive Action Trigger |
|---|---|---|---|
| 1. New Inbound Leads | Total fresh prospect inquiries received across all digital, aggregator, and inbound channels | Consistent with weekly media budget capacity | Flag if volume drops > 15% week-over-week or if lead source mix shifts unexpectedly |
| 2. Speed-to-Lead | Median seconds from lead timestamp to first automated and human outbound touch | Under 60 seconds (automated SMS/WhatsApp) / Under 3 min (human call) | Trigger emergency review if human contact latency exceeds 5 minutes |
| 3. Contact Rate | (Total leads reached with live 2-way conversation / Total new leads) × 100 | 65% to 75% across blended sources | Investigate dialer reputation or spam flags if contact rate dips below 55% |
| 4. Application Rate | (Applications submitted to Marketplace / Total leads contacted) × 100 | 38% to 52% for inbound inquiries | Retrain producers on subsidy qualification if conversion falls below 30% |
| 5. Gross Enrollments | Total verified policies bound with selected plan and submitted NPN | Aligned with weekly agency sales quota | Audit producer capacity and distribution routing if production stalls |
| 6. Binder Effectuation Rate | (Policies with paid binder or verified $0 premium / Total enrolled policies) × 100 | 92% to 96% of bound policies | Deploy automated payment reminder sequences if effectuation drops under 88% |
| 7. Missing DMI Backlog | Count and percentage of active policies with open citizenship, identity, or income DMIs | Under 8% of total active book | Activate dedicated document chasing team if open DMI inventory exceeds 10% |
| 8. Missing Consent Audit Deficit | Count of enrolled policies lacking verified timestamped audio or digital signature tokens | Strict 0% tolerance | Immediately freeze producer lead routing if any missing consent record is detected |
| 9. Net AOR Poaching & Changes | Inbound AOR transfers captured minus outbound policies hijacked by competing brokers | Net positive weekly ratio | Audit predator call center activity and deploy retention outreach if net loss occurs |
| 10. Weekly Early Cancellations | Total policies terminated due to non-payment, voluntary drop, or marketplace crosswalk rejection | Under 0.5% of active book per week | Conduct root-cause client interview if cancellations spike after month one |
| 11. Rolling Retention Rate | (Active policies remaining after 12 months / Total original cohort policies) × 100 | 84% to 90% across annual cohorts | Accelerate year-round engagement touchpoints if retention drops below 80% |
| 12. Commissions Expected | Sum of projected Per-Member-Per-Month (PMPM) fees across active paying lives | Predictable recurring cash flow baseline | Compare against carrier production statements to detect uncredited enrollees |
| 13. Commissions Received & Delta | Actual carrier direct deposit cash receipts minus Expected Commissions | Discrepancy delta < 2% | Trigger formal commission discrepancy claims if missing carrier payouts exceed $1,500 |
| 14. Client Referral Rate | (New clients originating from existing member referrals / Total new clients) × 100 | 14% to 22% of gross monthly volume | Launch automated post-enrollment NPS and referral prompts if under 10% |
| 15. Cost per Retained Client (CPRC) | Total blended acquisition and operational cost / Clients remaining active at month 12 | Under 1.5× average first-year commission | Cut underperforming marketing channels if CPRC exceeds first-year recurring revenue |
“Agencies do not fail from poor sales talent. They bleed out slowly through unworked DMIs, missing consent archives, and uncollected carrier commissions that no one looked at on Monday morning.”
Why Generic CRMs Fail to Deliver the ACA Scorecard
When agency owners attempt to build this scorecard in horizontal sales platforms like Salesforce, HubSpot, or generic dialers, they hit an immediate structural wall: generic CRMs have no native concept of a marketplace application, a Data Matching Issue, a HealthSherpa EDE webhook, or a PMPM commission schedule.
To track Metric 7 (Missing DMIs), a generic CRM requires manual data entry from carrier portals. To monitor Metric 8 (Missing Consent), agents must manually upload audio files to attachments. By the third week of Open Enrollment, producers stop entering data, the spreadsheet reports fall apart, and leadership is flying completely blind.
Want an automated weekly scorecard that syncs HealthSherpa policies, DMI alerts, and commission reconciliations out of the box? Explore CRMDAY Insurance CRM
The 30-Minute Monday Morning Governance Routine
Tracking these fifteen numbers does not require spending hours in complex business intelligence software. Follow this streamlined 30-minute operational ritual every Monday morning:
09:00 - 09:10 AM: Lead Velocity & Conversion Triage
Inspect Metrics 1 through 5. Check weekend lead volume, verify speed-to-lead latency, and adjust lead routing rules for underperforming producer queues.
09:10 - 09:20 AM: Risk, DMI & Compliance Quarantine
Inspect Metrics 6 through 10. Identify any policy lacking consent, review the 90-day DMI countdown list, and assign document follow-up tickets to administrative staff.
09:20 - 09:30 AM: Revenue Reconciliation & Unit Economics
Inspect Metrics 11 through 15. Compare carrier deposit statements against expected PMPM commissions, flag missing payouts, and calculate trailing Cost per Retained Client.
Agency Scorecard Implementation Checklist
To transition your brokerage from retrospective guesswork to proactive weekly governance, implement these operational foundations today:
The health insurance brokerages that build enterprise value over the next five years will not be the ones that shout the loudest during Open Enrollment. They will be the agencies with operational mastery: tracking these fifteen numbers every week, protecting their renewals with software, and compounding recurring revenue year after year.
Next step
Test it with your own workflows.
Start a free trial with a sample of your book, or bring your questions to a conversation with our team.
Sources
- HealthCare.gov — Dates and deadlines (opens in a new tab)
- CMS — Consumer consent and application review requirements (FAQ) (opens in a new tab)
- HealthCare.gov — How do I resolve a data matching issue? (opens in a new tab)
- NAIC — Insurance Data Security Model Law brief (August 2025) (opens in a new tab)
This article is for information only and reflects public information as of its publication date. It is not legal or tax advice. Confirm current rules with CMS, your state exchange and your carriers.