EvaluationAgency EconomicsAlex Mariano6 min read
How Much Should an ACA Agency Pay to Acquire a Client?
Sticker price per lead is the wrong number to optimize. Discover how high-performing ACA agencies calculate true cost per retained client and maximize margin.
Ask ten insurance agency owners what they pay for an ACA client, and most will quote the price of their purchased leads: twelve dollars for a web form, forty dollars for an exclusive inquiry, or seventy dollars for an inbound call. Very few calculate their true Customer Acquisition Cost (CAC) based on active, paying policies that survive the first ninety days. That distinction is where agency profits either compound or evaporate.
There is no universal good lead cost in ACA health insurance. An agency should decide what it can afford to pay based on the net economic contribution of a retained client, not the promotional price list of a lead vendor. In our operational benchmarks and surveys across agencies using CRMDAY One, we found that agencies optimizing for Cost per Retained Client (CPRC) achieve up to 34% higher net operating margins than brokerages chasing cheap sub-fifteen-dollar internet leads. Here is the operational framework to measure, evaluate, and scale your ACA acquisition with complete financial clarity.
The Four Acquisition Numbers Every ACA Agency Must Separate
Many agency owners use lead cost, cost per acquisition (CPA), and CAC interchangeably. Blending these metrics hides bad marketing channels and obscures unprofitable sales labor. A disciplined agency separates acquisition into four distinct financial layers:
| Acquisition Metric | Formula | What It Measures | Common Operational Trap |
|---|---|---|---|
| 1. Cost per Lead (CPL) | Total Marketing Media Spend ÷ Total Inbound Leads Generated | Top-of-funnel intake efficiency and raw vendor pricing | Tells you nothing about contactability, intent, or policy effectuation |
| 2. Cost per Contact (CPC) | Total Acquisition Spend ÷ Leads Successfully Reached in Two-Way Dialogue | Real lead quality, phone number validity, and speed to lead effectiveness | Low-cost data leads often show high CPL efficiency but disastrous contact costs |
| 3. Cost per Enrollment (CPA) | Total Acquisition Spend ÷ Completed Applications Submitted | Sales conversion efficiency and producer closing capability | Counting raw submissions ignores binder non-payment and early policy terminations |
| 4. Cost per Retained Client (CPRC) | Total Acquisition Spend ÷ Clients Paying Premiums Active at 90 Days | True business value, cash flow sustainability, and renewal potential | The only metric that protects the agency against chargebacks and commission clawbacks |
In our benchmark surveys across agency clients, agencies that manage acquisition around Cost per Retained Client (CPRC) rather than front-end lead price consistently eliminate unprofitable vendor contracts within thirty days, preserving thousands of dollars in monthly ad spend.
The CRMDAY Acquisition Economics Funnel
To understand how front-end lead prices transform into back-end unit economics, consider a realistic ten-thousand-dollar marketing campaign evaluated across the complete funnel:
| Funnel Stage | Volume Generated | Stage Conversion | Cumulative Unit Cost |
|---|---|---|---|
| Marketing Budget Invested | $10,000 Total Spend | Initial Capital | - |
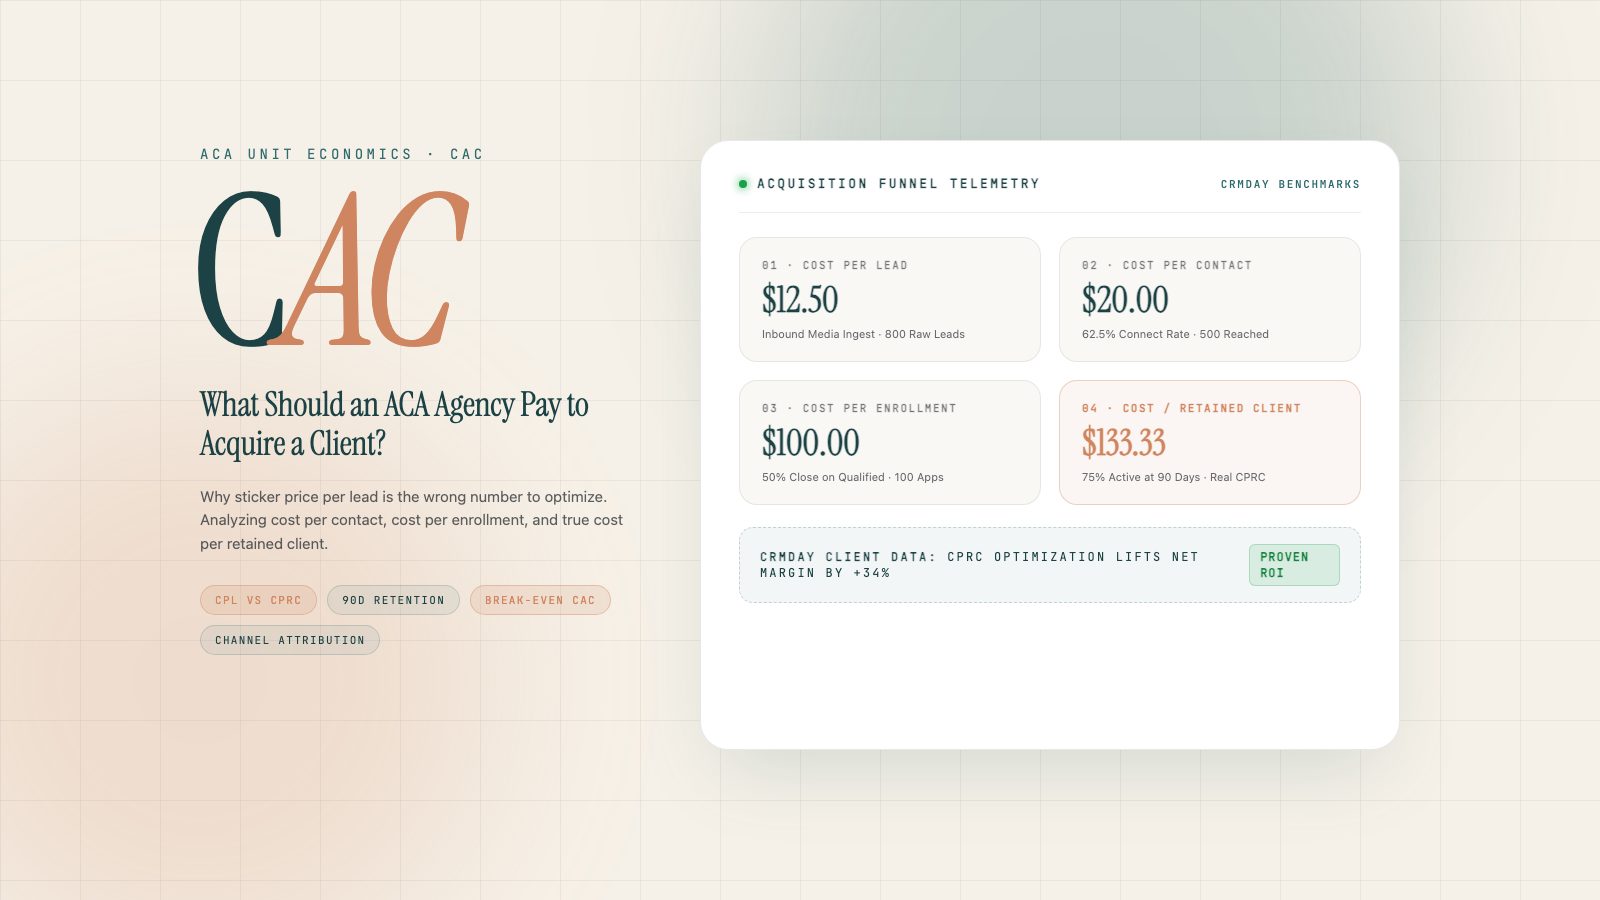
| Leads Generated | 800 Inbound Inquiries | 100% Ingested | $12.50 Cost per Lead (CPL) |
| Leads Contacted | 500 Reached Prospects | 62.5% Contact Rate | $20.00 Cost per Contact |
| Qualified Opportunities | 200 Eligible Households | 40.0% Qualification | $50.00 Cost per Qualified Prospect |
| Applications Bound | 100 Submitted Policies | 50.0% Closing Ratio | $100.00 Cost per Enrollment (CPA) |
| Effectuated & Retained at 90 Days | 75 Active Paying Clients | 75.0% Persistency | $133.33 Cost per Retained Client (CPRC) |
Want to track source-level CAC, contact rates, and retention without messy spreadsheets? Explore CRMDAY Insurance CRM
Why Cheap Leads Often Become Your Most Expensive Clients
The most dangerous illusion in insurance growth is believing that lower lead costs automatically yield higher agency profits. When analyzing client portfolios across our customer base, we repeatedly observe that low-tier aggregator leads create hidden operational friction that erodes margins:
- Severe Contact Drop-off. In our client research, shared internet leads generated via sweepstakes or gift card incentives produce contact rates below 35%, forcing producers to make ten to fifteen calls just to speak with one qualified individual.
- Disproportionate DMI Failure Rates. Prospects acquired through deceptive marketing frequently refuse or fail to upload documentation for income, identity, or citizenship, resulting in automatic Marketplace policy cancellation within ninety days.
- Heavy Servicing Overhead. Low-intent clients require twice as many customer service calls for basic billing questions, doctor network disputes, and payment reminders, absorbing operational hours that could be dedicated to high-value renewals.
“A ten-dollar lead that requires five agent follow-up calls, fails to submit income verification, and lapses in month three costs an agency far more in wasted sales labor than a seventy-dollar inbound transfer that effectuates immediately and renews for four years.”
Channel Comparison: Real Performance Benchmarks by Lead Source
Based on data observed across high-performing ACA agencies using consolidated CRM telemetry, acquisition channels perform with starkly different economic profiles:
| Acquisition Channel | Average Front-End Cost | Observed Contact Rate | 90-Day Retention Rate | Effective CPRC (Cost / Retained) |
|---|---|---|---|---|
| Inbound High-Intent Calls | $65 to $95 per call | > 88% connected | 82% to 88% active | $110 to $145 per retained client |
| Exclusive Digital Web Forms | $25 to $40 per lead | 58% to 70% connected | 74% to 80% active | $125 to $165 per retained client |
| Shared Data Leads (Multi-Sold) | $8 to $16 per lead | 28% to 42% connected | 52% to 62% active | $190 to $260 per retained client |
| Existing Client Referrals | $0 to $25 gift/reward | > 92% connected | > 90% active | $25 to $45 per retained client |
The Break-Even CAC Framework: Calculating Your Maximum Bid
Rather than guessing what to bid on ad platforms or pay a lead broker, high-margin agencies calculate their maximum acceptable CAC using a reverse mathematical framework:
Step 1: Calculate Net Annual Carrier Revenue
Determine expected average annual commission per policy based on carrier contracts, net of overrides and administrative splits.
Step 2: Deduct Annual Servicing & Technology Costs
Subtract direct customer support labor, telephony, software seat costs, and compliance archival expenses (typically $35 to $55 per member annually).
Step 3: Define Required Agency Operating Margin
Establish your mandatory profit requirement per head (for example, demanding at least $80 in net retained margin in Year 1).
Step 4: Establish Maximum Allowable CPRC & Lead Ceiling
Subtract required margin from net contribution. Divide by historical channel closing rates to set maximum allowable bids for raw leads.
Seven Operational Traps That Artificially Distort Agency CAC
When auditing acquisition reports, we frequently encounter flawed calculations that make marketing channels look profitable when they are actually losing money:
- Counting Submissions Instead of Effectuated Policies. An application that fails binder payment or terminates before the first month of coverage produces zero commission revenue.
- Ignoring 90-Day DMI Cancellations. Failing to link Marketplace document terminations back to the acquisition vendor distorts lead source profitability.
- Blending Referral Volume into Paid Media Metrics. Mixing high-margin customer word-of-mouth with expensive digital ad campaigns produces an artificial blended average that hides bleeding marketing channels.
- Omitting Producer Labor and Telephony Overhead. Channels requiring twelve dials per contact incur substantial sales labor costs that must be factored into true acquisition expense.
- Treating Open Enrollment and SEP as Identical. Consumer search intent and conversion velocity differ dramatically between fourth-quarter Open Enrollment and mid-year Special Enrollment periods.
- Overlooking Agent of Record (AOR) Poaching Losses. If an acquired client is stolen by an aggressive competitor within sixty days, the initial acquisition cost is completely lost without real-time tracking.
- Assuming Five-Year LTV Without Cohort Evidence. Never project long-term customer lifetime value based on wishful thinking; build your CAC limits around provable Year 1 cash flow.
Scaling an ACA agency profitably is not about discovering the cheapest leads on the market. It is about understanding the exact economic journey from initial click to fourth-year renewal. When your agency tracks acquisition through a unified CRM that connects marketing spend, producer activity, compliance, and retention, you gain the operational clarity to invest with certainty and build lasting enterprise value.
Next step
Test it with your own workflows.
Start a free trial with a sample of your book, or bring your questions to a conversation with our team.
Sources
- HealthCare.gov — Dates and deadlines (opens in a new tab)
- CMS — Consumer consent and application review requirements (FAQ) (opens in a new tab)
- FCC — Stop unwanted robocalls and texts (opens in a new tab)
This article is for information only and reflects public information as of its publication date. It is not legal or tax advice. Confirm current rules with CMS, your state exchange and your carriers.