EvaluationAgency ManagementAlex Mariano7 min read
Insurance Agency KPIs: The 20 Metrics Owners Should Track
Most agencies track monthly bind volume and discover retention drops 6 months later. Here is the operational scorecard with 20 metrics, exact formulas, and benchmarks.
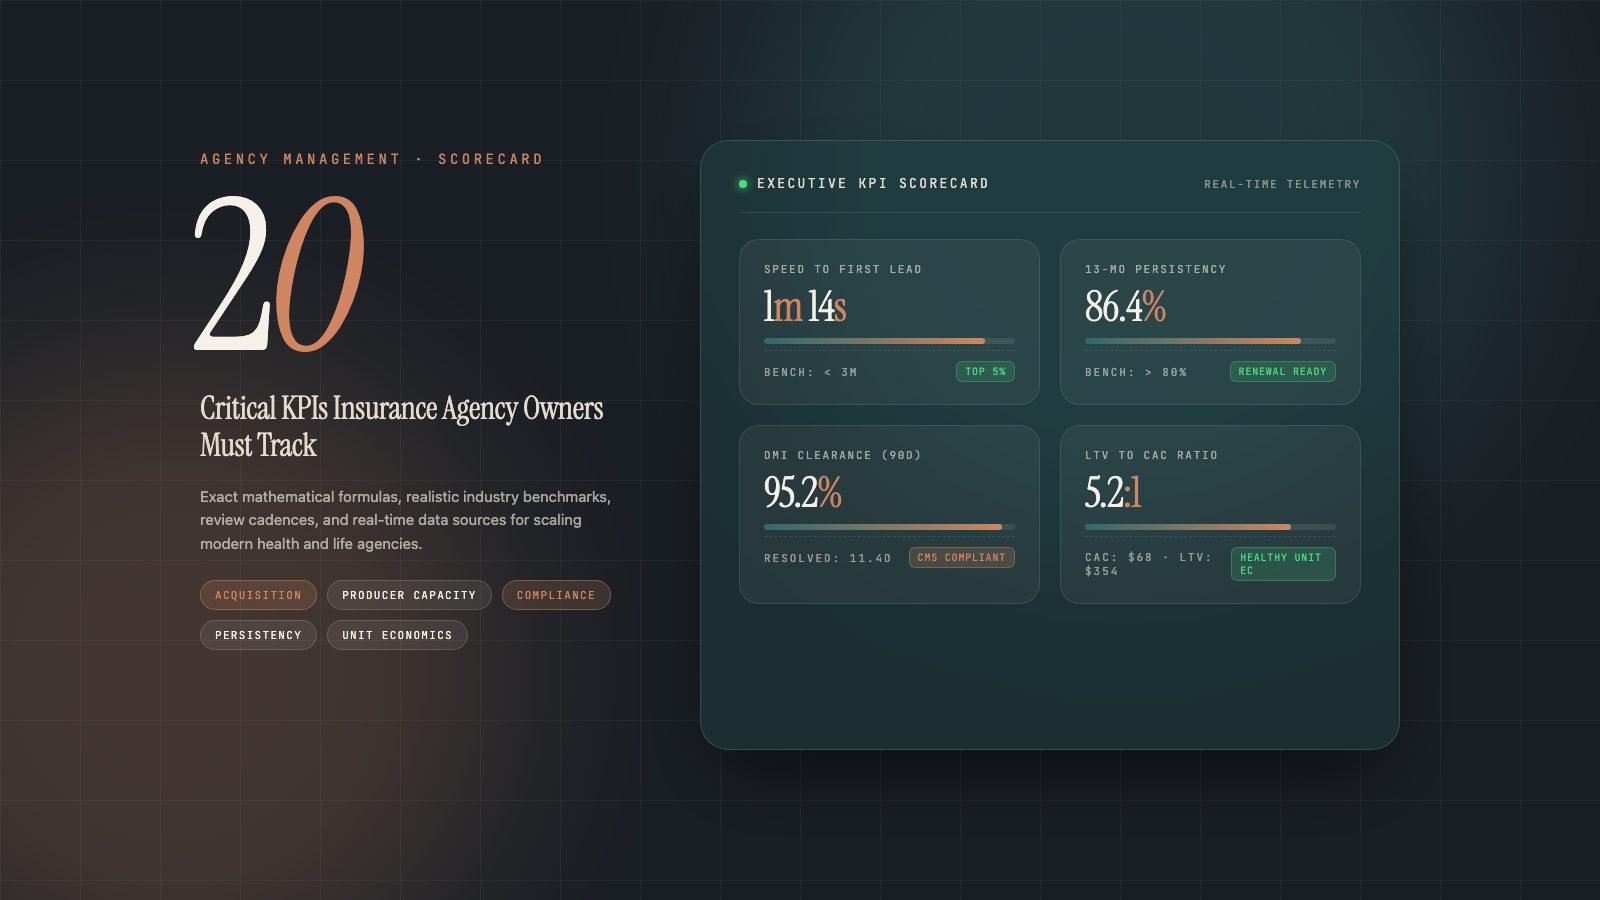
Ask ten insurance agency owners how their business is performing, and nine will quote their total bind count or gross written premium from last month. Very few can tell you their median speed to lead during peak hours, their 90-day DMI clearance rate, their commission leakage percentage, or their true 13-month persistency curve by lead vendor. Those blind spots silently erode enterprise valuation and cash flow.
Managing an insurance agency by top-line production alone is like flying an airplane looking only at the altimeter while ignoring fuel, oil pressure, and airspeed. To build a resilient, scalable operation, owners need a balanced scorecard covering five essential operational pillars: Lead Acquisition, Agent Sales Capacity, Post-Enrollment Compliance, Policy Retention, and Financial Unit Economics. Below are the 20 critical KPIs every owner must monitor, complete with exact formulas, industry benchmarks, review frequencies, and primary data sources.
Pillar 1: Lead Acquisition & Speed to Lead (Top of Funnel)
In consumer health and life insurance, lead decay happens in minutes. If your intake systems fail to connect with prospects immediately, your acquisition budget is subsidized for competitors.
| Metric | Formula | Market Benchmark | Frequency | Primary Data Source |
|---|---|---|---|---|
| 1. Speed to First Contact | Median time from lead ingest timestamp to first completed outbound call, SMS, or WhatsApp dispatch | < 3 minutes (elite agencies achieve < 60 seconds during operating hours) | Real-time / Daily | CRM + Integrated CTI / WhatsApp Webhook |
| 2. Contact / Connect Rate | (Unique Leads Reached with Two-Way Dialogue ÷ Total Inbound Leads Ingested) × 100 | 55% – 72% for verified digital web leads; > 88% for live inbound transfers | Daily / Weekly | CRM Call Disposition Logs & SMS Responses |
| 3. Lead-to-Quote Conversion | (Unique Prospects with Formal Plan Comparison Presented ÷ Total Contacted Leads) × 100 | 42% – 60% across qualified health & term life prospects | Weekly | CRM Pipeline Deals in Quoting Stage |
| 4. Customer Acquisition Cost (CAC) | (Total Media Ad Spend + Lead Purchases + Intake Software Costs) ÷ Total Bound New Policies | $50 – $95 per bound ACA policy; $140 – $320 for Life & Annuities | Monthly | Marketing Ad Platforms + CRM Won Deals Ledger |
In ACA and commercial health, responding in under 3 minutes yields up to 4x higher bind rates than waiting 30 minutes. Measuring speed to lead by human conversation, not automated auto-responders, is what separates high-velocity agencies.
Pillar 2: Agent Sales Production & Capacity
High producer turnover and inconsistent closings usually stem from lack of granular pipeline visibility. Tracking individual velocity and closing efficiency helps identify training gaps before quotas are missed.
| Metric | Formula | Market Benchmark | Frequency | Primary Data Source |
|---|---|---|---|---|
| 5. Quote-to-Bind Ratio | (Total Successfully Bound Policies ÷ Total Formal Quotes Delivered) × 100 | 50% – 70% for targeted ACA consultations; 35% – 50% for Life products | Weekly / Monthly | CRM Deal Stage Conversion (Quoted → Bound) |
| 6. Daily Bound Policies per Producer | Total New Bound Applications ÷ (Active Full-Time Producers × Working Days) | OEP Peak: 8–18 apps/agent/day; Non-OEP & Year-Round: 1.5–4 apps/agent/day | Daily (Hourly during OEP) | Enrollment Engine (HealthSherpa / Carrier Portals) + CRM |
| 7. Active Talk Time & Dial Velocity | Total Inbound + Outbound Connected Call Duration ÷ Total Scheduled Production Hours | 2.5 – 3.5 hours talk time / 85 – 140 outbound dials per agent per day | Daily | Integrated Cloud Dialer / CTI Telephony Logs |
| 8. Sales Cycle Duration (Pipeline Velocity) | Sum of elapsed calendar days from lead creation to policy binding ÷ Total Bound Deals | ACA Individual: < 24–48 hours; Term Life: 7–14 days; Final Expense: 1–3 days | Weekly / Monthly | CRM Deal Stage Timestamps |
Want to eliminate manual data entry between your dialer, quoting engine, and pipeline? Explore CRMDAY Insurance CRM
Pillar 3: Post-Enrollment, Documentation & Compliance
Acquiring a client is meaningless if the policy terminates within 90 days due to unverified documentation or compliance violations. Operational excellence lives in post-enrollment execution.
| Metric | Formula | Market Benchmark | Frequency | Primary Data Source |
|---|---|---|---|---|
| 9. DMI / Document Clearance Rate | (Data Matching Issues Cleared & Approved by CMS ÷ Total Policies Flagged with DMIs) × 100 | > 92% resolved within CMS 90-day statutory window | Weekly | HealthSherpa / Marketplace API + CRM Service Tickets |
| 10. Consumer Consent Compliance Rate | (Auditable 10-Year Call Audio Records + Signed CMS Forms ÷ Total Applications Submitted) × 100 | 100% (Zero-tolerance statutory requirement under CMS guidelines) | Weekly Audit | CRM Audio Vault & Electronic Signature Repository |
| 11. Agent of Record (AOR) Retention Rate | (Active In-Force Policies with Agency NPN Retained on Carrier Ledgers ÷ Total Initial Submissions) × 100 | > 88% across full plan year (protects against unauthorized poaching) | Monthly | Carrier Commission Statements vs. Active Book in CRM |
| 12. Average DMI Resolution Turnaround | Sum of elapsed calendar days from CMS inconsistency notice to carrier approval ÷ Total Cleared DMIs | < 14 calendar days (rapid clearance prevents client coverage termination) | Monthly | CRM Document Task Workflows |
“An agency that writes 1,000 ACA policies during Open Enrollment with a 15% DMI failure rate loses 150 clients before March. Operational compliance is not a legal chore: it is your primary revenue retention hedge.”
Pillar 4: Retention, Persistency & Customer Lifetime Value
Agency enterprise valuation multiples are determined almost entirely by recurring renewal stability. Agencies with superior 13-month persistency trade at substantially higher valuation multiples than high-churn boiler rooms.
| Metric | Formula | Market Benchmark | Frequency | Primary Data Source |
|---|---|---|---|---|
| 13. 13-Month Policy Persistency | (Active In-Force Policies Paying Premium at Month 13 ÷ Initial Bound Policies at Month 1) × 100 | ACA Individual: 78% – 86%; Term & Whole Life: 82% – 91% | Monthly / Quarterly | Carrier Commission Books & AMS In-Force Reports |
| 14. Monthly Policy Churn (Lapse Rate) | (Policies Cancelled, Terminated, or Lapsed for Non-Payment in Month ÷ Active Policies at Month Start) × 100 | < 1.4% – 1.9% per month during non-renewal season | Monthly | Carrier Delinquency Notices & AMS Policy Status |
| 15. Open Enrollment Renewal Rate | (Returning Insureds Actively Renewed for Upcoming Plan Year ÷ Total Eligible In-Force Book) × 100 | 76% – 88% active retention across OEP (Nov 1 – Jan 15) | Seasonal (OEP) | CRM Renewal Workflows & HealthSherpa Batch Renewals |
| 16. Cross-Sell / Multi-Policy Ratio | (Insured Households Holding ≥ 2 Active Policies with Agency ÷ Total Unique Insured Households) × 100 | 20% – 35% (e.g., ACA Health bundled with Dental, Vision, or Hospital Indemnity) | Quarterly | CRM Multi-Product Client Records |
Pillar 5: Unit Economics, Revenue & Financial Health
High gross revenue means nothing if commission leakage, uncollected overrides, and exorbitant acquisition costs consume your net operating margin.
| Metric | Formula | Market Benchmark | Frequency | Primary Data Source |
|---|---|---|---|---|
| 17. Customer Lifetime Value (LTV) | Average Annual Net Commission per Policy × Average Policy Lifespan (Years) × Multi-Policy Multiplier | ACA: $650 – $1,250 net revenue; Life & Annuities: $1,800 – $4,800 | Quarterly / Annual | Historical Actuarial Persistency + Commission Ledgers |
| 18. LTV to CAC Ratio (LTV:CAC) | Customer Lifetime Value (LTV) ÷ Customer Acquisition Cost (CAC) | 3.5:1 – 6.0:1 (under 3:1 signals unsustainable ad burn; over 7:1 signals under-investment in growth) | Monthly / Quarterly | Agency Executive BI Dashboard (LTV ÷ CAC) |
| 19. Net Revenue per Producer | Total Net Retained Agency Commission Revenue ÷ Total Active Licensed Producers | $140,000 – $320,000 per full-time captive/independent producer annually | Monthly / Annual | Commission Accounting System + Producer Roster |
| 20. Commission Reconciliation Leakage | (Absolute Dollar Amount of Unmatched, Missing, or Disputed Carrier Payments ÷ Expected Gross Commissions) × 100 | < 0.8% with automated reconciliation (manual spreadsheets frequently leak 3%–7%) | Monthly | Carrier 820/835 Electronic Statements vs. CRM Book |
How to Build Your Agency KPI Review Cadence
Dumping 20 metrics into a single monthly meeting leads to analysis paralysis. High-performing agencies distribute their KPI reviews into four structured operating cadences:
Daily Standup (10 min)
Speed to First Contact (< 3m), Outbound Dials & Talk Time, Daily Bound Policies by Producer, and Live Intake Queue.
Weekly Pipeline Review (45 min)
Quote-to-Bind Ratio by Lead Source, Open DMIs nearing the 90-day deadline, Consent Recording Audits, and Agent Talk Time.
Monthly Financial Reconciliation (2 hrs)
13-Month Persistency curve, Commission Reconciliation Discrepancy, CAC by Acquisition Channel, and LTV:CAC performance.
Quarterly Strategic Capacity (Half-Day)
Net Revenue per Producer, Cross-Sell Penetration, Carrier Contract Overrides, and Tech Stack Consolidation ROI.
Building an agency that compounds enterprise value requires moving beyond fragmented spreadsheets and guesswork. When your CRM unifies lead intake, telephony, quoting, compliance, and commission tracking into one system of record, these 20 metrics update automatically in real time, giving you the clarity to scale with confidence.
Next step
Test it with your own workflows.
Start a free trial with a sample of your book, or bring your questions to a conversation with our team.
Sources
- CMS — Consumer consent and application review requirements (FAQ) (opens in a new tab)
- HealthCare.gov — How do I resolve a data matching issue? (opens in a new tab)
- FCC — Stop unwanted robocalls and texts (opens in a new tab)
- NAIC — Insurance Data Security Model Law brief (August 2025) (opens in a new tab)
This article is for information only and reflects public information as of its publication date. It is not legal or tax advice. Confirm current rules with CMS, your state exchange and your carriers.