EvaluationManagementSimone Figueira3 min read
12 KPIs every insurance agency should track, and how to calculate them
Most agencies track sales every week and retention once a year. This scorecard fixes the balance, with formulas you can apply this month.
Ask ten agency owners for their numbers and most will tell you how many policies they wrote last month. Far fewer know how many clients they lost, how long a new lead waits for a reply or how many renewals were contacted before the due date. Those are the numbers that predict next year's book.
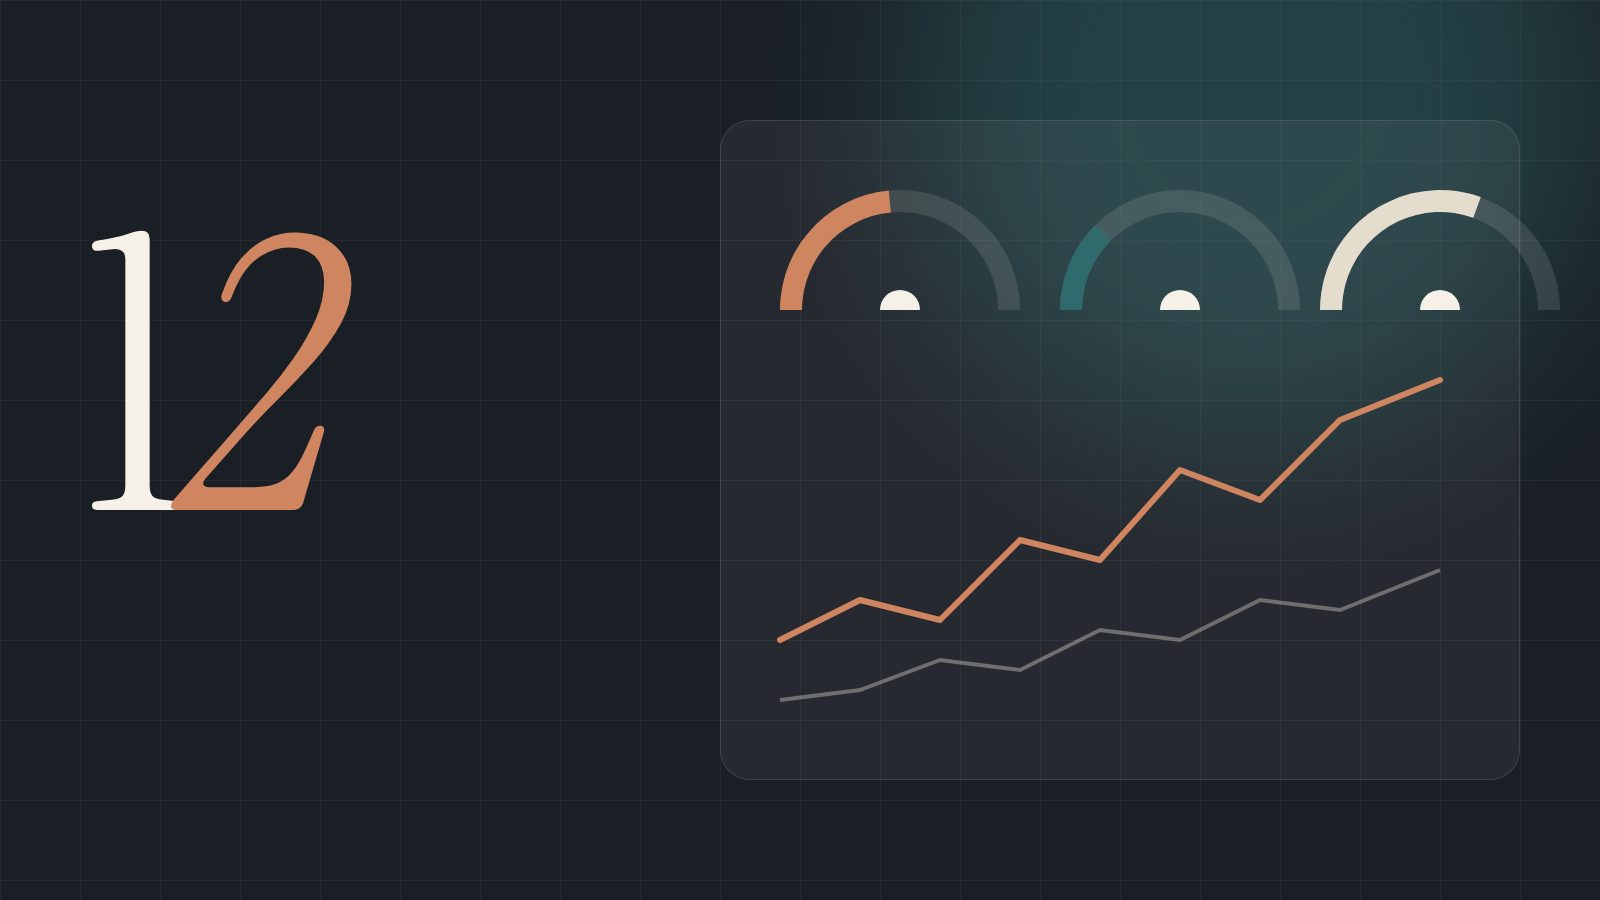
This scorecard groups 12 KPIs into five areas. For each one: the formula, the data it needs and the most common way it gets distorted. We deliberately don't publish "industry benchmarks": they vary too much by line, state and model. Your own trend over time is the benchmark that matters.
Acquisition
| KPI | Formula | Needs | Watch out |
|---|---|---|---|
| 1. Speed to lead | Median time from lead creation to first meaningful contact | Lead timestamp and first human or useful reply | Automatic acknowledgments inflate it; measure useful contact |
| 2. Contact rate | Leads reached ÷ leads received | Contact outcome per lead | Count reached people, not attempts |
| 3. Cost per acquired client | Marketing and lead spend ÷ new clients | Spend by source and client source | Without source tracking, every channel looks equal |
Conversion
| KPI | Formula | Needs | Watch out |
|---|---|---|---|
| 4. Close rate by source | New clients ÷ qualified leads, per source | Lead source and qualification stage | Blended close rates hide bad sources |
| 5. Quote-to-bind | Policies bound ÷ quotes presented | Quote and policy linked to the same opportunity | Quotes outside the CRM make this impossible |
A KPI you can't calculate from your CRM is a KPI your team isn't recording. Start there.
Retention
| KPI | Formula | Needs | Watch out |
|---|---|---|---|
| 6. Client retention rate | Clients active at period end who were active at start ÷ clients active at start | Client status with dates | Don't count new clients in the numerator |
| 7. Lapse rate with reason | Terminated policies ÷ active policies, grouped by reason | Termination date and a reason field | "Other" as the top reason means the field isn't used |
| 8. On-time renewal contact | Renewals with a contact before due date ÷ renewals due | Renewal dates, activities linked to policy | Contacts in personal phones don't count |
| 9. Policies per household | Active policies ÷ active households | Household model and policies by line | Rising only if cross-sell is real, not duplicates |
Retention KPIs depend on a CRM that models households and policies correctly. Read: the data model behind a good insurance CRM
Service
| KPI | Formula | Needs | Watch out |
|---|---|---|---|
| 10. First response time | Median time to first reply on inbound client messages | All channels in one inbox | Averages hide the long tail; use median and 90th percentile |
| 11. Case resolution on time | Cases closed before due date ÷ cases due (DMIs, requests) | Cases with due dates and owners | Cases without due dates are invisible to this metric |
Team
| KPI | Formula | Needs | Watch out |
|---|---|---|---|
| 12. Workload balance | Open cases and leads per agent, relative to the team median | Ownership on every record | Unassigned work doesn't show up, so measure it separately |
How to build the scorecard
- 01Pick five, not twelve. Start with speed to lead, close rate by source, retention rate, on-time renewal contact and first response time.
- 02Fix the data before the dashboard. For each KPI, confirm the fields exist and are filled in. A week of cleanup beats a month of wrong charts.
- 03Set a rhythm. Service and speed metrics weekly; conversion monthly; retention monthly and by quarter.
- 04Always segment. By line of business, source and agent. Totals hide the problems.
- 05Tie each KPI to an action. If speed to lead worsens, what changes? Who owns it? A metric without an owner is decoration.
“Dashboards that no one uses are noise. Design metrics for the meeting where decisions are made.”
Three ways KPIs lie
- Survivorship: measuring only clients who stayed in the system and ignoring those never recorded.
- Averages: one agent with very fast replies can make a slow team look fine; use medians and distributions.
- Moving definitions: if "qualified lead" changes every quarter, the close rate trend means nothing. Write the definitions down.
Next step
Test it with your own workflows.
Start a free trial with a sample of your book, or bring your questions to a conversation with our team.